Crisis Overview Dashboard
Comprehensive analysis of major US financial crises and their economic impact
Crisis Timeline
Great Depression
1929-1939Peak unemployment: 24.75%
Black Monday
1987Stock market crash: -22.6%
Dot-com Bubble
2000-2002NASDAQ decline: -78%
Great Recession
2007-2009Housing price decline: -33%
COVID-19 Crisis
2020-2021GDP decline: -2.2%
Most Severe Crisis
Longest Recovery
Fastest Recovery
Recent Impact
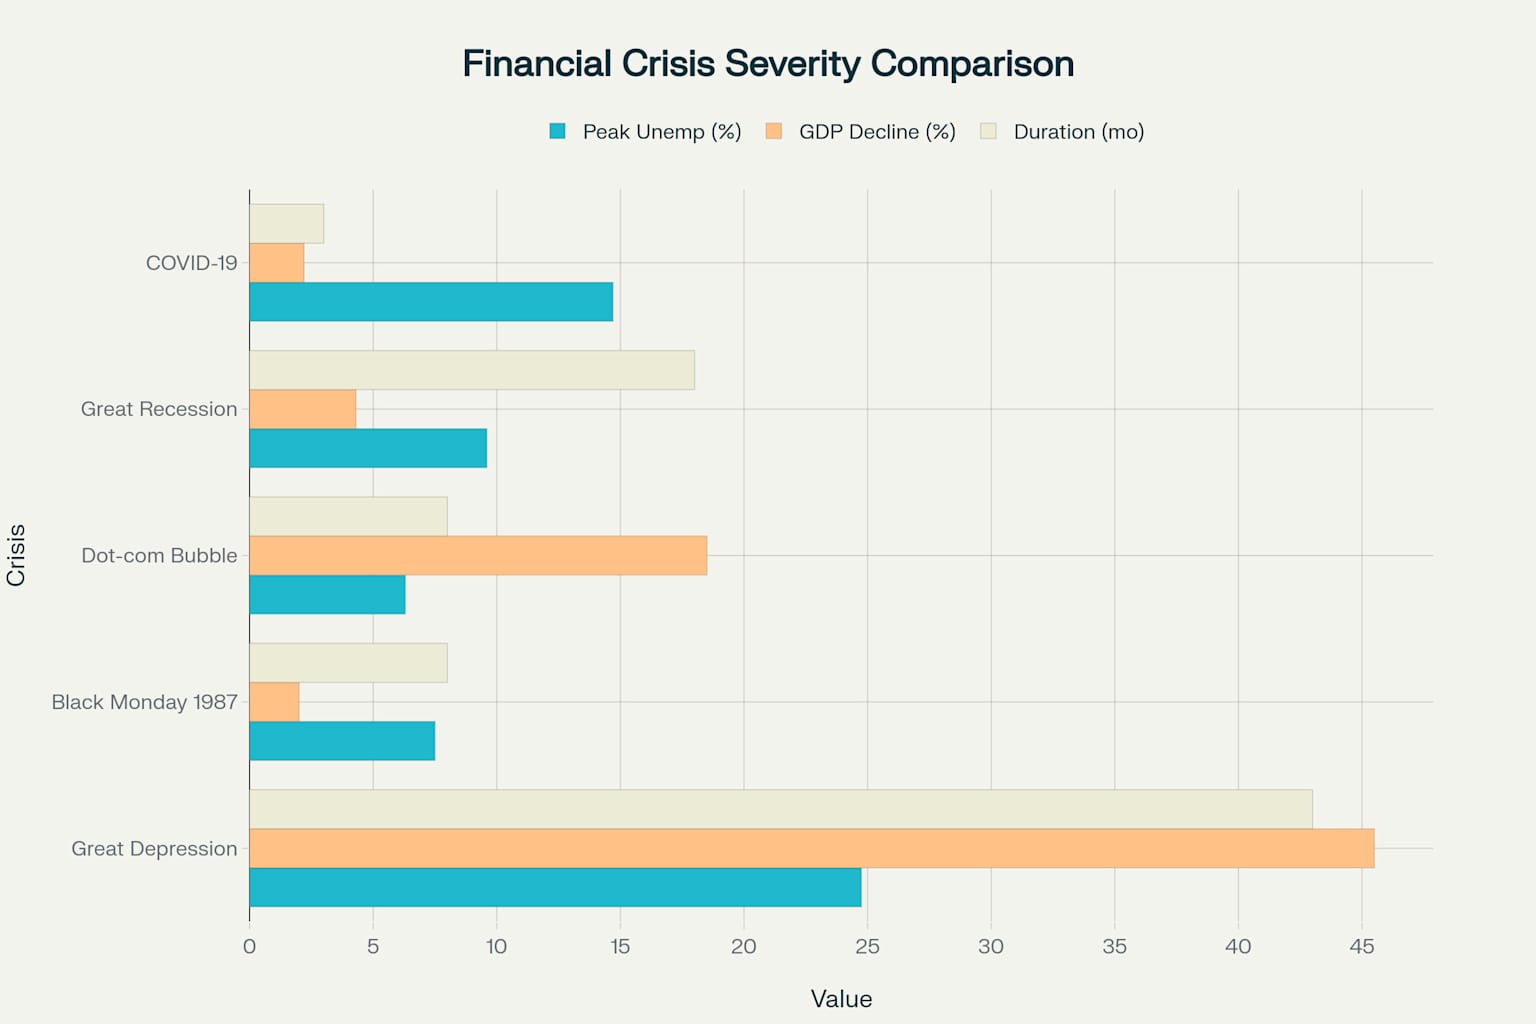
Crisis Comparison Overview
The Great Depression (1929-1939)
The most severe economic downturn in US history
Crisis Overview
The Great Depression began with the stock market crash of October 1929 and lasted until the late 1930s. It was the worst economic downturn in the history of the industrialized world, causing widespread unemployment, poverty, and economic hardship.
Key Facts
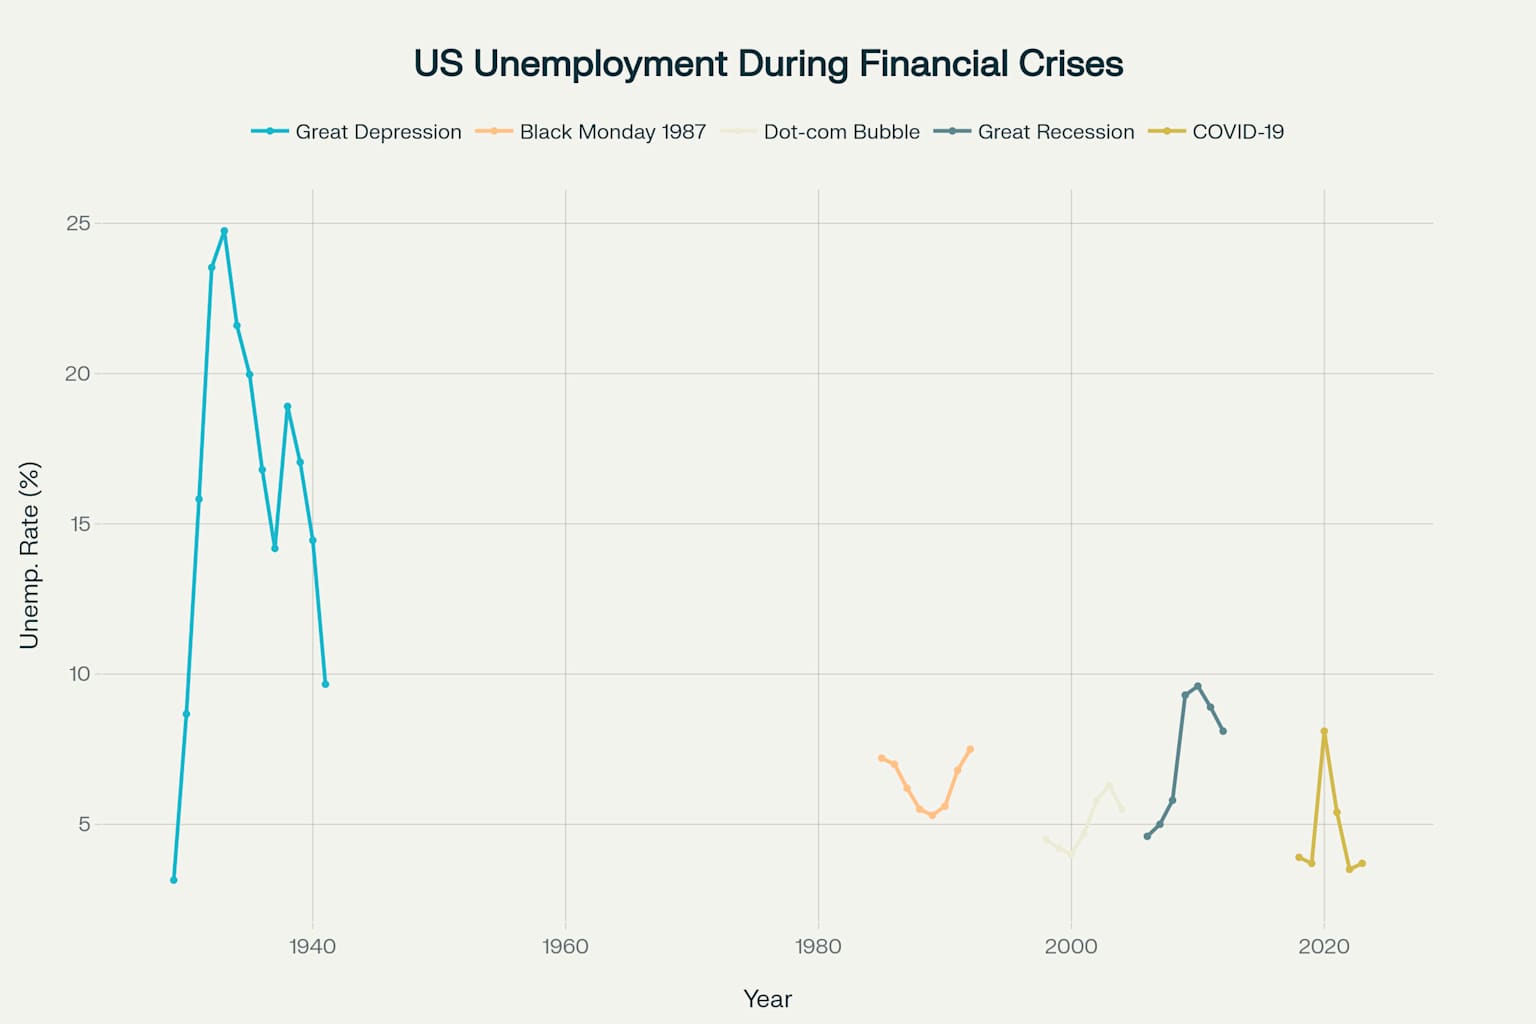
- Peak unemployment reached 24.75% in 1933
- GDP declined by 45.5% from 1929 to 1933
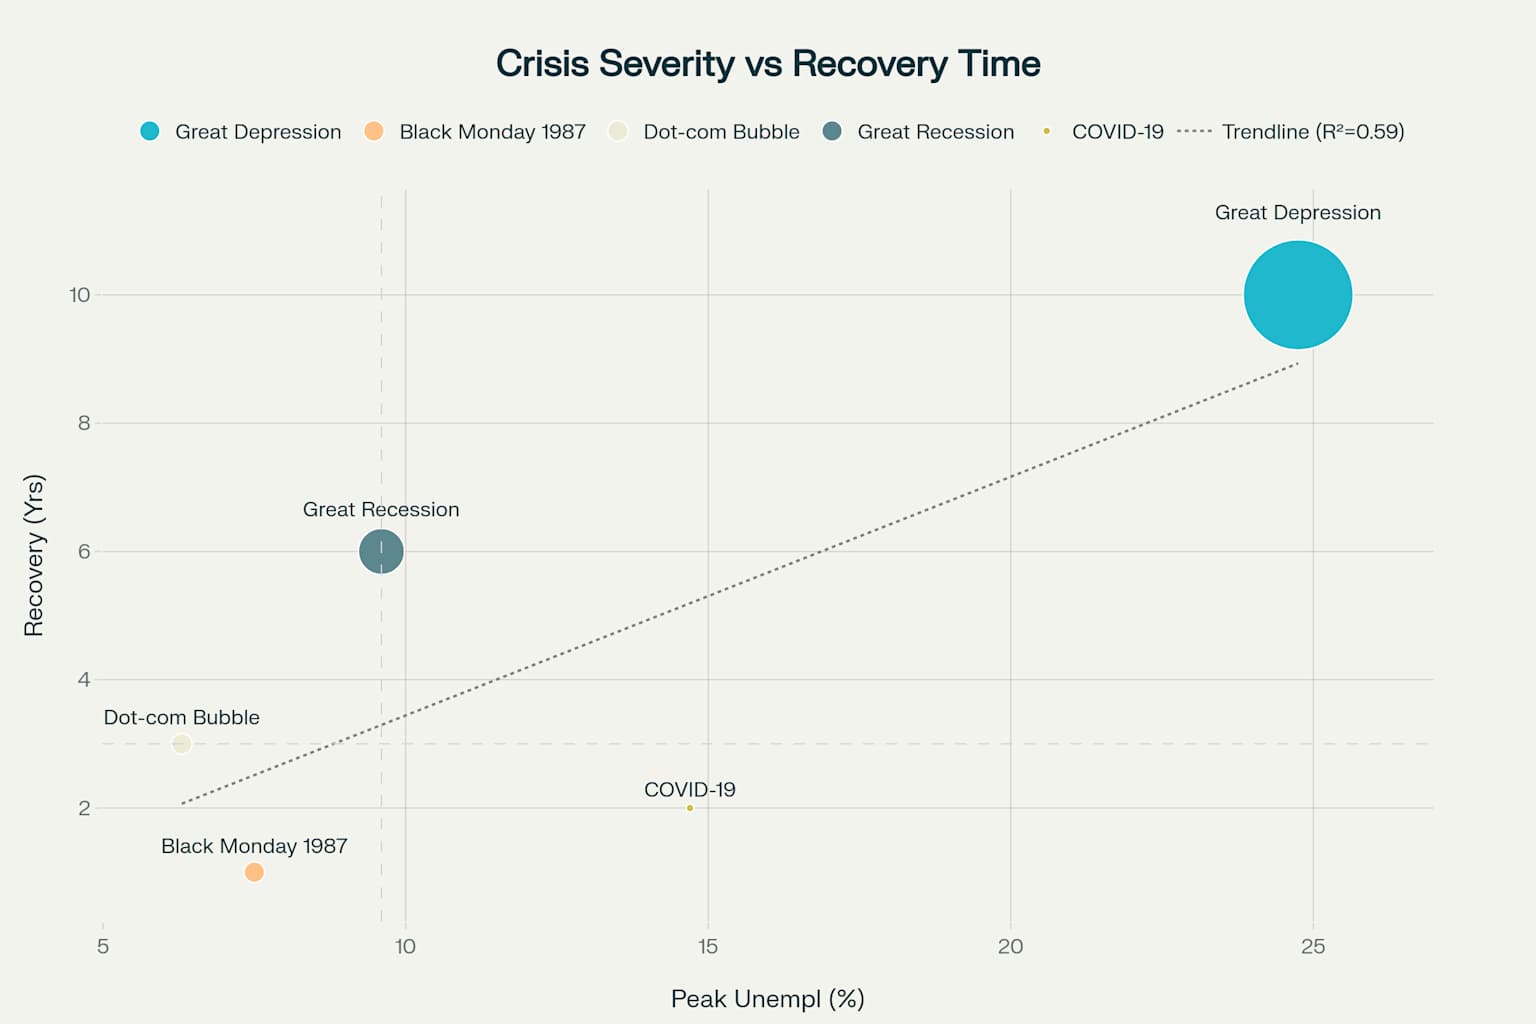
- Lasted approximately 10 years
- Triggered by stock market crash and bank failures
Economic Indicators
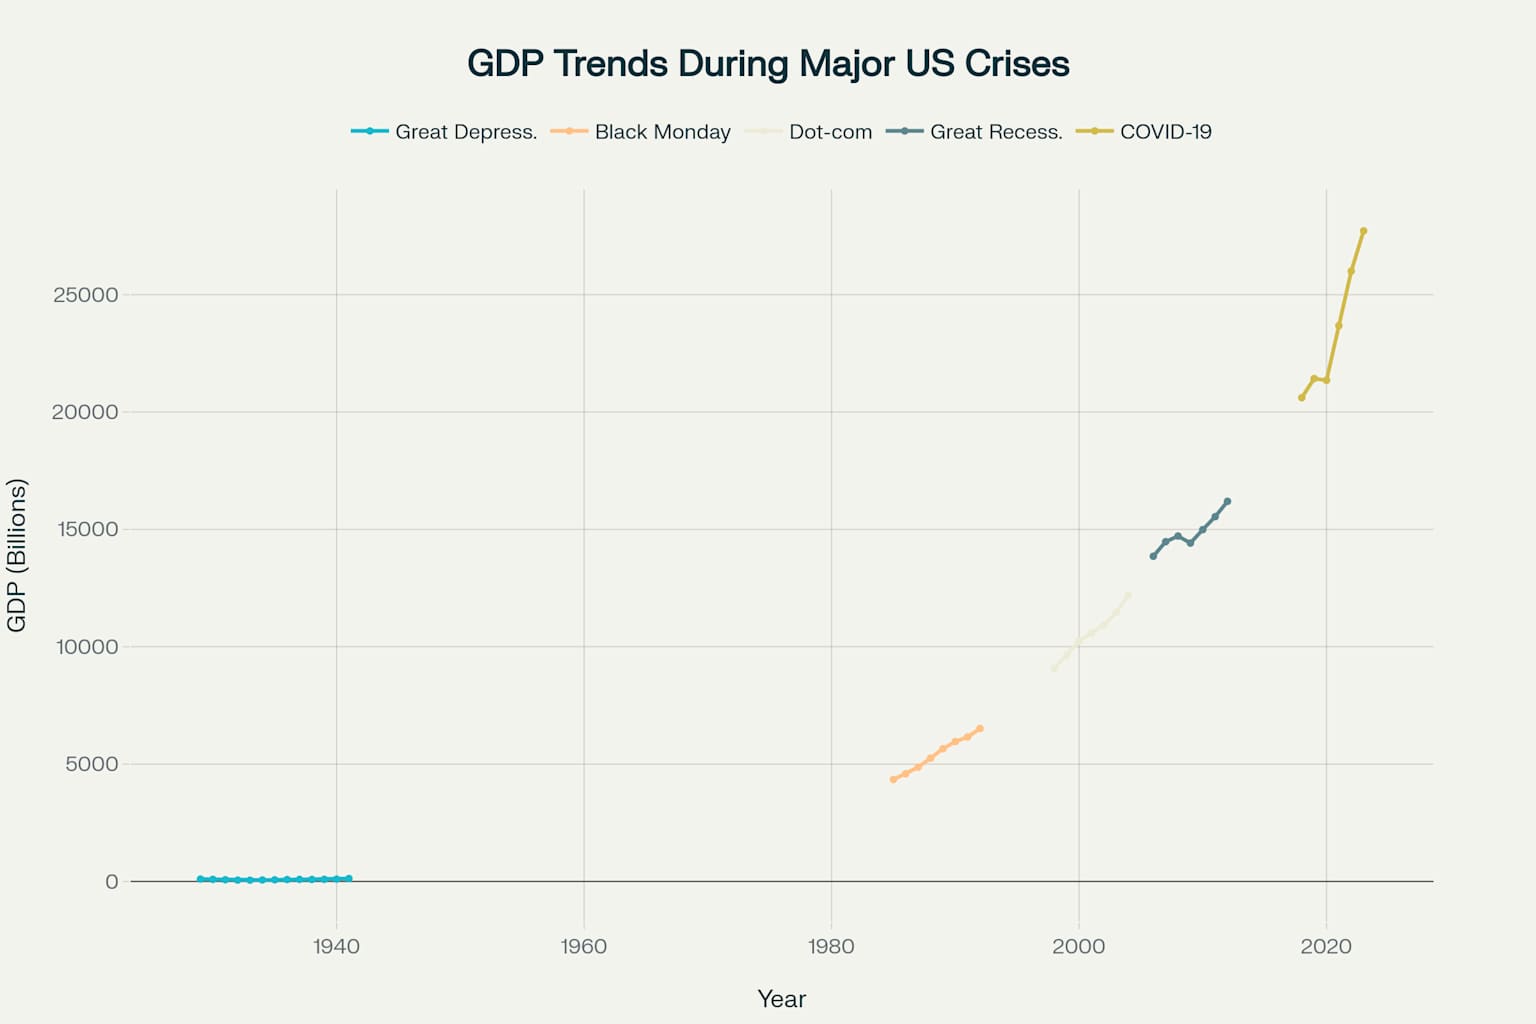
GDP Impact
From $103.6B to $56.4B
Peak Unemployment
In 1933
Deflation
Worst deflation in 1932
Recovery Time
Full economic recovery
Black Monday (1987)
The largest single-day stock market decline in US history
Crisis Overview
On October 19, 1987, stock markets around the world crashed, with the Dow Jones Industrial Average falling 22.6% in a single day. Despite the severity of the crash, the economy recovered relatively quickly.
Key Facts
- Single-day market decline of 22.6%
- Peak unemployment of 7.5% in 1992
- Recovery within 1-2 years
- Minimal impact on GDP growth
Economic Indicators
Stock Market
Single day decline
Peak Unemployment
In 1992
GDP Impact
Continued growth
Recovery Time
Quick market recovery
Dot-com Bubble (2000-2002)
The collapse of internet and technology stocks
Crisis Overview
The dot-com bubble was a period of excessive speculation in internet-related companies during the late 1990s. The bubble burst in 2000, leading to a significant decline in technology stocks and a mild recession.
Key Facts
- NASDAQ declined 78% from peak to trough
- Peak unemployment of 6.3% in 2003
- Technology sector devastated
- Recovery took about 3 years
NASDAQ Decline
From peak to trough
Peak Unemployment
In 2003
GDP Impact
Continued growth but slower
Recovery Time
Full market recovery
Great Recession (2007-2009)
The worst economic downturn since the Great Depression
Crisis Overview
The Great Recession was triggered by the collapse of the housing bubble and subsequent financial crisis. It resulted in widespread unemployment, home foreclosures, and required massive government intervention.
Key Facts
- Peak unemployment of 9.6% in 2010
- Housing prices declined 33%
- Major bank failures and bailouts
- Recovery took about 6 years
Housing Decline
Peak to trough
Peak Unemployment
In 2010
GDP Decline
From peak
Recovery Time
Full employment recovery
COVID-19 Crisis (2020-2021)
The pandemic-induced economic shutdown
Crisis Overview
The COVID-19 pandemic caused an unprecedented economic shutdown as governments implemented lockdown measures. The crisis was unique in its speed and the massive fiscal and monetary response.
Key Facts
- Peak unemployment reached 14.7% in April 2020
- Shortest but sharpest recession
- Massive government stimulus response
- Rapid recovery with inflation concerns
Peak Unemployment
April 2020
GDP Impact
In 2020
Inflation Peak
In 2021
Recovery Time
Quick GDP recovery
Crisis Comparison
Compare economic indicators across all major crises
Unemployment Comparison
GDP Trends
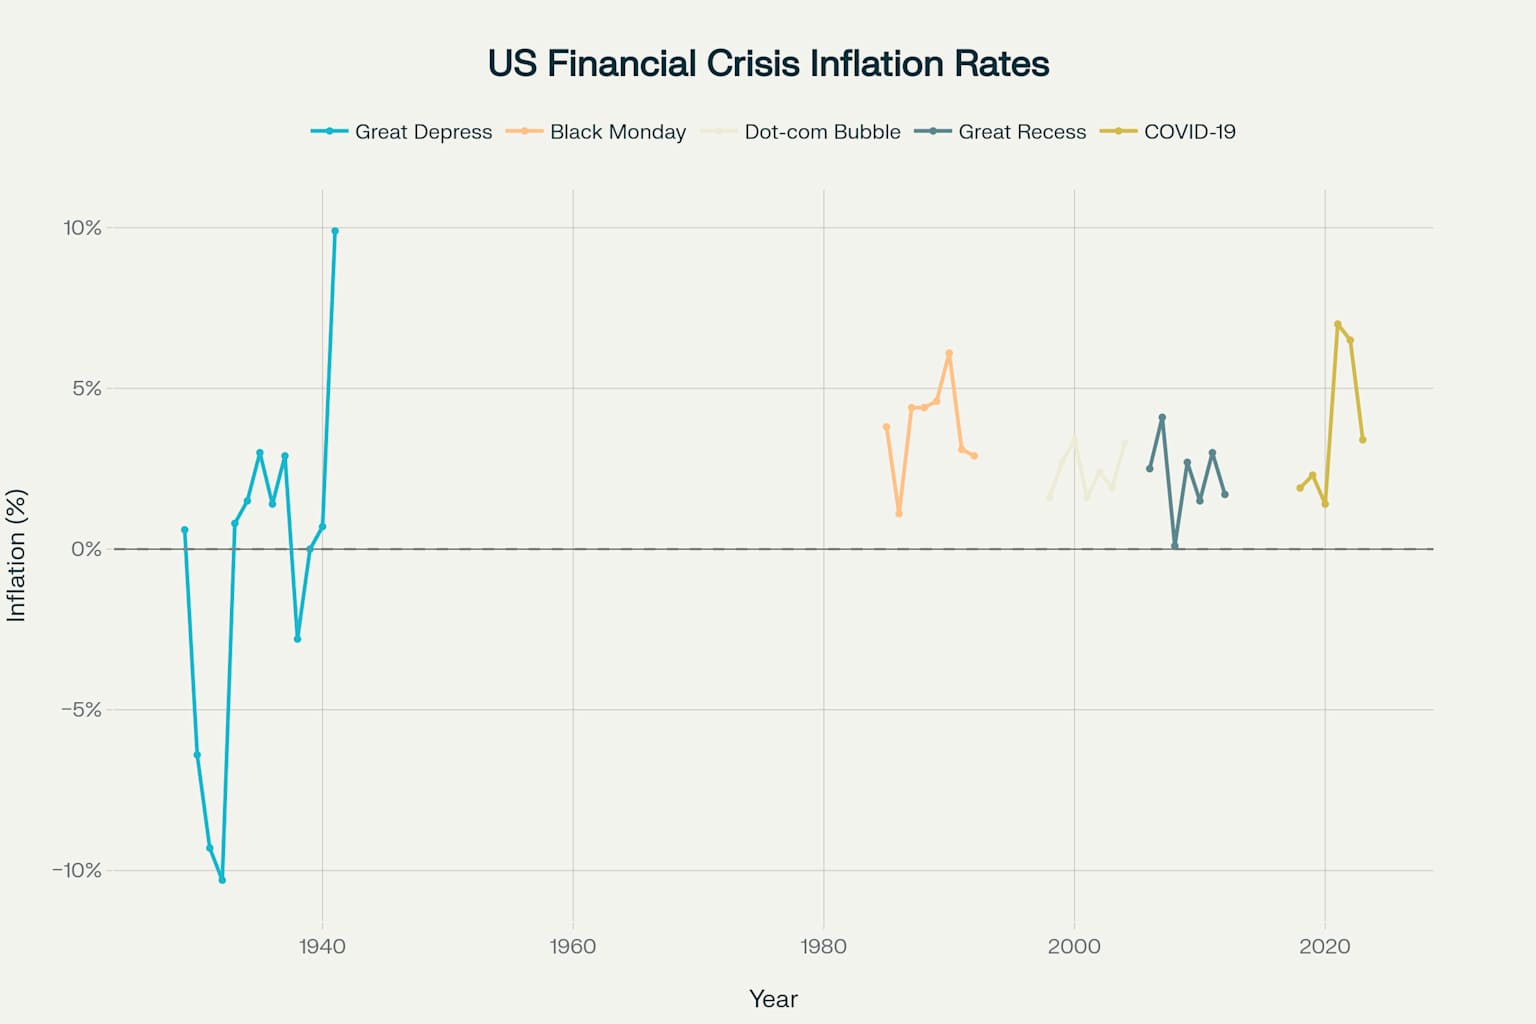
Inflation Analysis
Crisis Severity vs Recovery